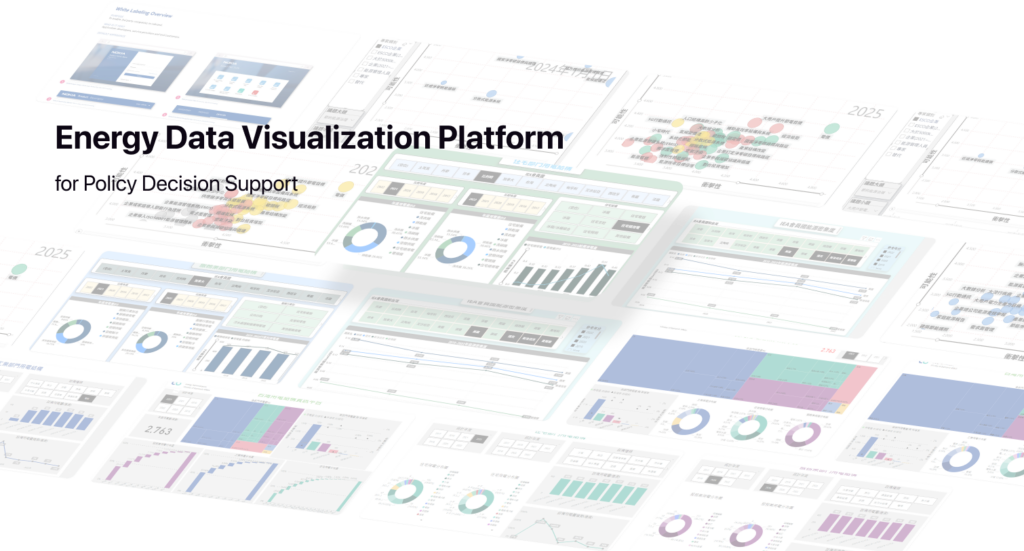
Overview
A data visualization platform for policymakers.Problem:
Problem : Energy data is complex and difficult to interpret.
Outcome:
Enabled policymakers to explore and understand data efficiently.
Problem

Users

Design Decision
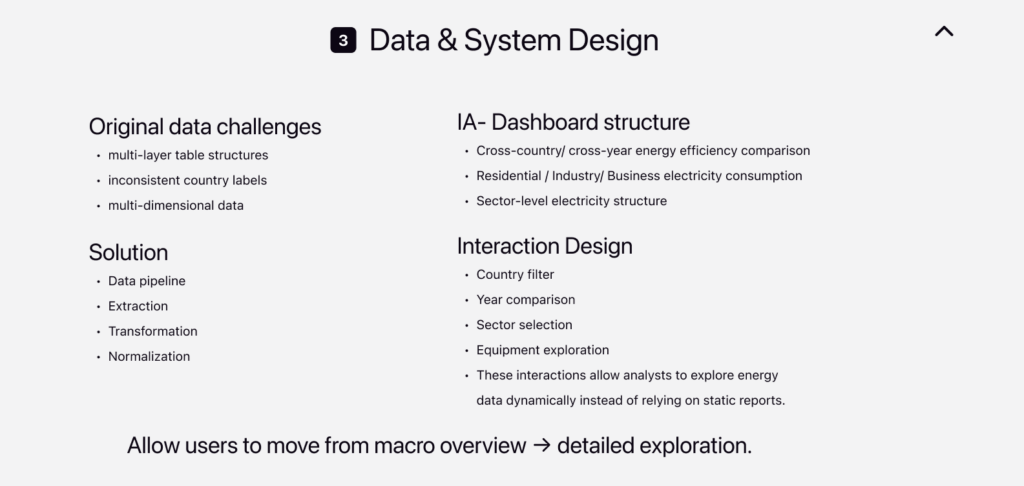
- Designed multi-level data exploration
- Built filtering system for cross-country comparison
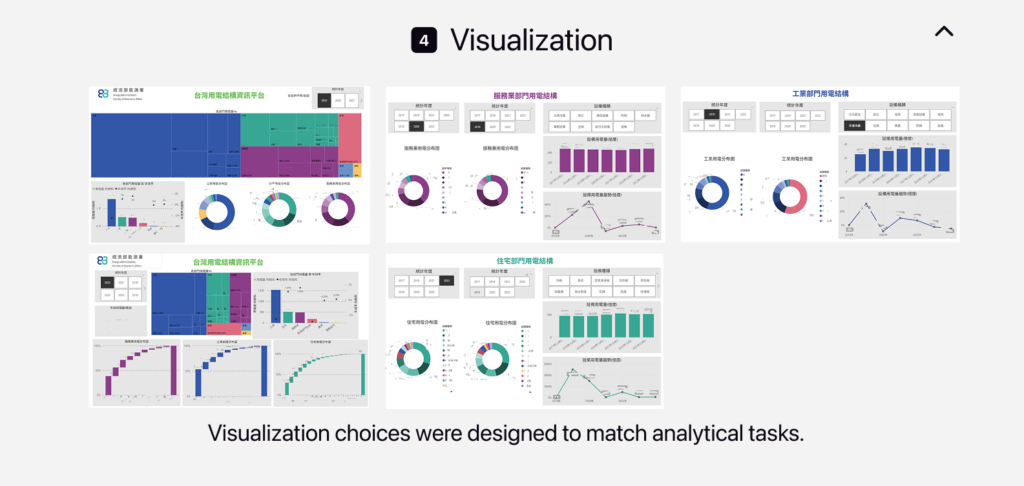
- Structured dashboards based on analytical tasks
Solution
Impact
C
Role : Data Visualization Designer
Timeline : 12 months (1 cycle)
Team : Policy Analysts, Energy Researchers(SMEs), Government Stakeholders
Impact : Delivered a national-scale energy data visualization platform that enabled policymakers to interpret multi-sector energy consumption, identify high-impact intervention areas, and support evidence-based energy policy planning
Executive Summary : Global economies accelerate toward net-zero emissions, energy efficiency has emerged as one of the most critical levers. For Taiwan, energy policy today is no longer shaped by isolated metrics, but by a complex system of indicators.
This project reframes data visualization from a reporting tool into a policy support infrastructure, enabling faster, more informed, and more transparent decision-making in Taiwan’s energy transition
Taiwan’s energy system operates under multiple structural constraints:
- High dependency on energy imports
- Increasing pressure from global net-zero commitments
- Rapid evolution of international policy frameworks (IEA, EU, etc.)
- Multi-sector energy consumption patterns (industry, service, residential)
Policy decision-making currently depends on:
- Dispersed datasets
- Static reports
- Domain-specific interpretation
This creates a high cognitive load and low decision velocity for policymakers.